

3 Minutes Read
Listen to the Blog
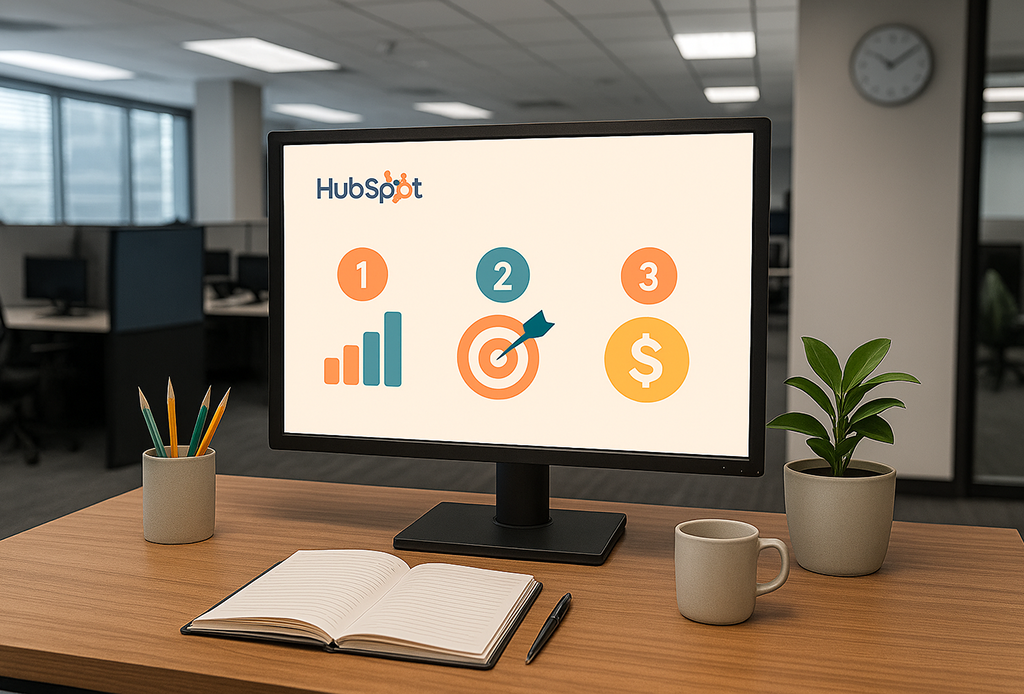
HubSpot Dashboards That Actually Help You Hit Sales Targets
2:40
Because pretty graphs don’t close deals—clarity does.
Have you ever opened a dashboard and thought, “Looks great… but what do I do with this?"
You’re not alone.
Most dashboards are built to look impressive in meetings. But if your sales team can’t use them to spot problems, plan their next move, or track what’s working, they’re just noise.
Let’s change that.
If you’re using HubSpot, here’s how to build dashboards that help you hit targets, and fix what’s broken before the month ends.
What Every Good Dashboard Should Show You:
Ask yourself this:
- Where are deals getting stuck?
- Are we on track to hit this month’s number?
- Who on the team needs a push or a high five?
- Which lead sources are generating revenue for us?
If your dashboard can answer those questions in under 30 seconds, you’re on the right track. If not, let’s fix it.
Must-Have Reports for Your Sales Dashboard
If you want your sales and marketing teams to take action, you need reports that highlight exactly where things stand and what needs attention. Here are the key ones every team should have on their HubSpot dashboard:
Pipeline by Deal Stage
This report shows the number of deals in each stage of your pipeline. It helps you see if deals are progressing or getting stuck.
-
Spot bottlenecks in real-time
-
Understand stage-wise drop-off
-
Identify where to coach your team
Forecast vs. Actual Revenue
This report compares how much revenue you expected to close vs. what you’ve won this month.
-
Track if you're on pace to hit goals
-
Adjust focus mid-month if needed
-
Useful in team reviews and leadership updates
Win/Loss Rate by Month
This report shows your closing success over time. It compares won vs. lost deals as a percentage.
-
See how sales performance is trending
-
Measure the impact of training or changes
-
Review reasons why deals are lost
Average Sales Cycle Length
Please determine how long it takes for a deal to close after it is entered into your pipeline. This gives insight into speed and efficiency.
-
Identify stages where deals slow down.
-
Compare velocity across sources or reps.
-
Spot patterns that delay conversions
Revenue by Lead Source
This report identifies which marketing sources are generating actual revenue, not just leads.
-
Know where your best leads come from
-
Prove ROI on paid or organic channels
-
Reallocate the budget based on results
Stalled Deals (No Recent Activity)
This pulls up all open deals that haven’t had activity in the last 7–14 days. Great for keeping your pipeline fresh.
-
Ensure reps follow up regularly
-
Reduce lead leakage
-
Add alerts to remind reps automatically


%201.png?width=1016&height=912&name=image%20(54)%201.png)